SuiteAnalytics Workbook is a powerful, built-in NetSuite tool that combines advanced reporting capabilities with an intuitive user interface. While the name might sound like just another reporting feature, NetSuite SuiteAnalytics Workbook is anything but ordinary – it’s a fantastic tool for businesses looking to extract deeper insights from NetSuite without writing a single line of code.
If you’re still relying on saved searches and static reports, it’s time to rethink how you approach data analysis in NetSuite – after all, there are multiple analytics options in NetSuite. Let’s dive into what SuiteAnalytics Workbook is, why it matters, and how you can use it to elevate your data-driven decisions.
The basics of SuiteAnalytics Workbook
SuiteAnalytics Workbook is NetSuite’s native reporting and analytics tool, offering a pivot table-like interface to create custom reports, visualisations and datasets. But unlike traditional reporting tools, SuiteAnalytics Workbooks allow users to interact with data dynamically. You can slice, dice, and drill into records in real-time – all without needing technical expertise.
The tool was introduced as a response to limitations in saved searches and standard reports, which often required users to export data into external tools like Excel for advanced analysis. SuiteAnalytics Workbook effectively eliminates that dependency, delivering multi-dimensional analysis directly within NetSuite’s environment.
Breaking down the SuiteAnalytics Workbook technicalities
At its core, SuiteAnalytics Workbook operates on NetSuite’s unified data model. This means you’re not creating silos of analysis or importing disparate datasets. Instead, you’re tapping into the same real-time data that powers your entire ERP system. Here’s how it all comes together:
Datasets
Every workbook begins with a dataset. Think of this as the foundation for your analysis. Datasets combine fields, criteria and filters across multiple record types, giving you the flexibility to customise what data gets included. The interface is entirely drag-and-drop, allowing users to add and refine data elements visually.
Visualisation tools
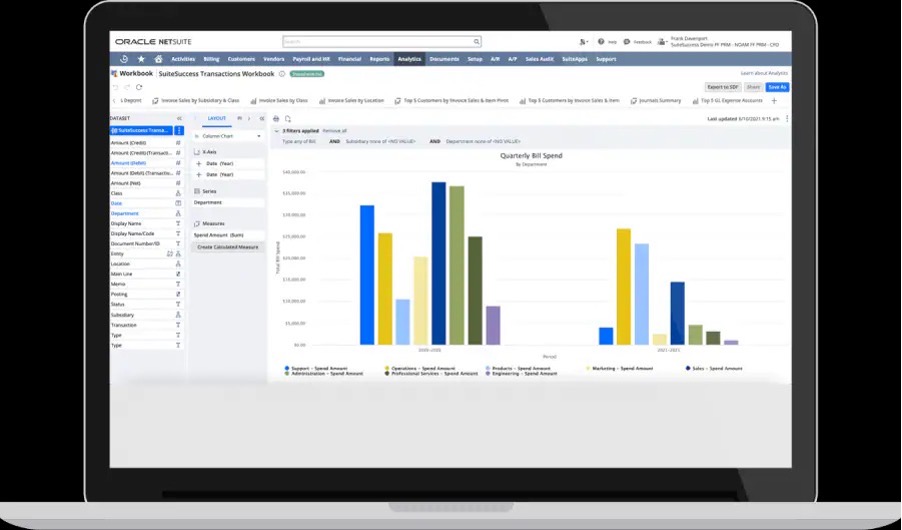
SuiteAnalytics Workbook supports creating pivot tables, charts and tables, so users can visualise their data in ways that best suit their needs. From bar charts showing monthly revenue to pivot tables analysing customer trends, there are many possibilities.
Query capability
Unlike static reports, SuiteAnalytics Workbook introduces query-based analysis. This allows users to link records dynamically and drill down into the details without predefining rigid report structures. Whether it’s querying line-level transaction data or joining unrelated records, the tool’s flexibility ensures your analysis can adapt on the fly.
Real-time interaction
You don’t need to wait for exports or batch processes – SuiteAnalytics Workbooks provide real-time data interaction. As you filter, sort or group records, the results update instantly, so you can get the info you need to make decisions faster.
Key features of SuiteAnalytics Workbooks
So, what makes SuiteAnalytics Workbook stand out in NetSuite’s reporting ecosystem? Here are some of its most notable features:
- Multi-level joins | Workbooks can connect data across multiple record types, overcoming the limitations of saved searches. For example, you can build a report that pulls in data from both invoices and inventory records – without needing SQL knowledge.
- Drag-and-drop interface | The user-friendly design allows even non-technical users to build complex analyses. Add fields, define filters and visualise data in a matter of clicks.
- Dynamic filtering | Filters in SuiteAnalytics Workbook are highly customisable and can be applied at runtime, allowing users to view specific subsets of data as needed.
- Prebuilt templates | NetSuite offers a library of prebuilt workbooks for common use cases, including financial analysis, sales trends and inventory management. These templates provide a head start while still allowing customisation.
- Export options | While the tool is designed to reduce dependency on Excel, users can export their workbooks as CSV files if needed, ensuring compatibility with other platforms.
Advanced use cases of SuiteAnalytics Workbook
SuiteAnalytics Workbook shines in scenarios where businesses need to go beyond surface-level insights. Here are a few technical use cases:
- Sales performance analysis | Use a workbook to track sales trends by region, product category or customer segment. Add calculated fields to analyse year-over-year growth or identify top-performing sales reps.
- Inventory optimisation | Combine inventory data with sales forecasts to identify potential stock shortages. Use dynamic filters to focus on high-priority items or locations.
- Financial reconciliation | Create a workbook that cross-references GL data with bank transactions, making it easier to identify discrepancies without switching between multiple reports.
- Customer Lifetime Value (CLV) | Build a dataset that combines transaction history, customer demographics and service interactions to calculate CLV, giving you actionable insights for marketing and retention strategies.
Some common challenges you might encounter
While SuiteAnalytics Workbook is powerful, it’s not without its learning curve. Here are some common challenges and how to address them:
Understanding data relationships
The ability to join records is a double-edged sword. If you’re unfamiliar with how NetSuite structures its data, you may struggle to define effective joins.
- Solution: Consult with a NetSuite partner or administrator to map out data relationships.
Performance with large datasets
Workbooks are real-time, but querying large volumes of data can impact performance.
- Solution: Use filters and summarised fields to narrow down your data before visualising it.
Advanced formatting needs
While SuiteAnalytics Workbook supports charts and tables, some users may require more advanced visualisation options.
- Solution: Export your dataset to tools like Power BI or Tableau if needed or explore NetSuite’s advanced analytics solution, NetSuite Analytics Warehouse (NSAW).
Why choose SuiteAnalytics Workbook?
SuiteAnalytics Workbook offers a balance of simplicity and power, making it a must-have tool for businesses looking to unlock their NetSuite data’s potential. Whether you’re a finance analyst, an operations manager or a sales leader, the tool equips you to make smarter, faster decisions – all within the familiar NetSuite ecosystem.
Get started today
SuiteAnalytics Workbook is already available in your NetSuite account – no additional setup required. Dive in today to create your first workbook, or better yet, partner with a NetSuite expert like Annexa, to explore advanced use cases tailored to your business needs.
Want a walkthrough?
If you’re an existing Annexa customer, contact us to discuss if SuiteAnalytics Workbook is right for you.
Learn more:
- NetSuite data and analytics: a practical guide for growing businesses >
- Introducing NetSuite Analytics Warehouse [Video demo] >
- From dashboards to data lakes – exploring NetSuite Analytics Warehouse (NSAW) >
- NetSuite SuiteAnalytics vs NetSuite Analytics Warehouse
- Turn numbers into narratives with NetSuite’s financial reporting & analytics tools >
- How NetSuite Analytics Warehouse consolidates your data for richer business insights >
- The mega guide to NetSuite modules (2024) >